Alert Rules
Alert rules are designed to monitor specific conditions within your system, such as performance degradation or potential failures. They help ensure your infrastructure stays healthy by triggering notifications when key metrics cross predefined thresholds. This allows your team to respond quickly to emerging issues, minimizing downtime and maintaining system reliability.
In this section, you can create Prometheus Rules to define custom alerting conditions suited to your needs, giving you greater control over how your environment is monitored and how critical events are communicated.
View Alert Rules
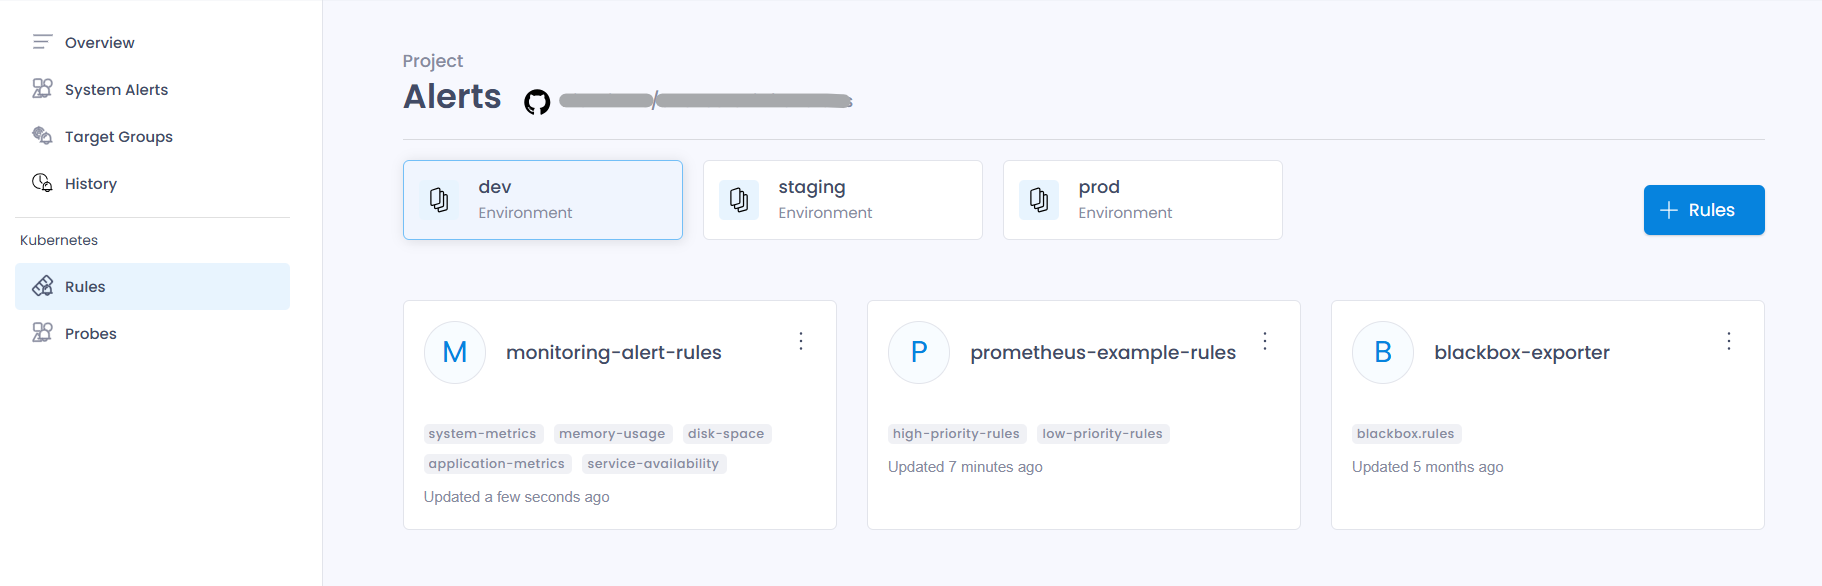
Navigate to the Alerts section in the SkyU Console on the left-hand side menu. Navigate to Rules in the Kubernetes section to view all existing alert rules.
You can select each environment card to view the specific alert rules associated with that environment.
Add Alert Rule
Click on + Rules to introduce a new Custom Alert Rule into your environment.
This process essentially creates a PrometheusRule Custom Resource Definition (CRD) and applies it to the cluster.
Metadata Details
| Field | Description | Example |
|---|---|---|
| Name | The unique identifier for this PrometheusRule object. It helps in managing and referencing the rule set within Kubernetes. | example-alert-rule |
| Environment | Specifies the environment where this PrometheusRule applies. | prod |
| Labels | Key-value pairs used for categorization and selection. These labels enable the Prometheus Operator to identify which PrometheusRule objects should be applied to a specific Prometheus instance (Optional). | prometheus: my-prometheus |
| Additional Metadata | Includes extra metadata to provide further context and categorization for the resource, such as namespace, annotations etc (Optional). | namespace: monitoring |
Configuration Details
You can define alerting rules for Prometheus either by uploading a file or by directly entering the rules in the provided code editor. The alerting rule format. For more details on alerting rule syntax, options, and a detailed explanation of the fields used in Prometheus alert rules, refer to the official Prometheus Alerting Rules (opens in a new tab)
Here’s an example.
{
  "groups": [
    {
      "name": "high-priority.rules",
      "rules": [
        {
          "alert": "HighPriorityAlert",
          "expr": "vector(1)",
          "annotations": {
            "summary": "High Priority Alert",
            "description": "This is a high priority alert that fires whenever vector(1) is evaluated to 1."
          },
          "labels": {
            "severity": "critical",
            "namespace": "example-namespace"
          }
        }
      ]
    }
  ]
}
Finally click on Save button to save it.
The input fields you provide in the setup process finally create the following PrometheusRule Custom Resource Definition (CRD):
apiVersion: monitoring.coreos.com/v1
kind: PrometheusRule
metadata:
  name: example-alert-rule
  namespace: monitoring
  labels:
    prometheus: my-prometheus
spec:
  groups:
    - name: high-priority.rules
      rules:
        - alert: HighPriorityAlert
          expr: vector(1)
          annotations:
            summary: "High Priority Alert"
            description: "This is a high-priority alert that fires whenever vector(1) is evaluated to 1."
          labels:
            severity: critical
            namespace: example-namespace
Update Alert Rule
To update an existing Alert Rule, click the Edit icon next to the rule you wish to modify, make the necessary changes, and then click the Save button to save it.
Remove Target Group
To delete an existing Alert Rule, click the Delete icon next to the Alert Rule you wish to remove, confirm the action, and then press the Delete button to finalize the deletion.