Probes
Probes are automated checks that monitor the health and status of your services, containers, or pods. They help ensure your system is running smoothly by performing periodic checks to see if services are functioning as expected. If any issues are detected, probes trigger alerts or actions, allowing your team to address problems before they affect system performance.
Setup: Installing Prometheus Blackbox Exporter
To monitor external services and execute health checks using probes, you need to install the Prometheus Blackbox Exporter in your Kubernetes cluster.
Navigate to the Clusters section in the SkyU Console on the left-hand side menu. Select the desired Cluster.
Next, go to the Plugins section to view all available plugins. Click on + Plugins.Navigate to All Plugins tab. Search prometheus-blackbox-exporter and intsall it.
View Alert Rules
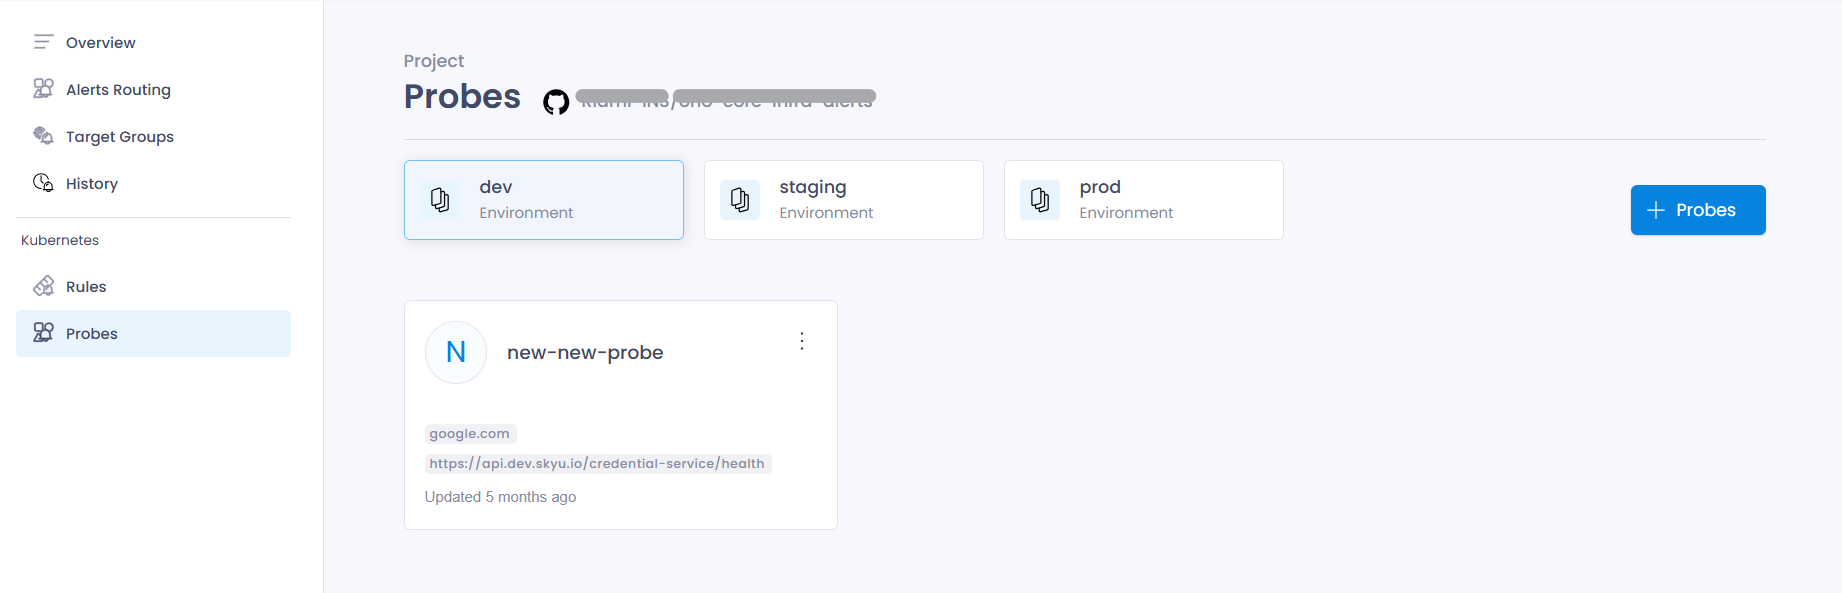
Navigate to the Alerts section in the SkyU Console on the left-hand side menu. Navigate to Probes in the Kubernetes section to view all existing probes.
You can select each environment card to view the specific probes associated with that environment.
Add Probe
Click on + Probes to introduce a new Probe into your environment.
This process essentially creates a Probe Custom Resource Definition (CRD) and applies it to the cluster.
Metadata Details
| Field | Description | Example |
|---|---|---|
| Name | The unique identifier for this Probe object. It helps in managing and referencing the probe set within Kubernetes. | example-probe |
| Environment | Specifies the environment where this Probe applies. | prod |
| Labels | Key-value pairs used for categorization and selection. These labels allow the operator to identify which Probe objects should be applied to a specific service or container. (Optional). | probe: service-health |
| Additional Metadata | Includes extra metadata to provide further context and categorization for the resource, such as namespace etc (Optional). | namespace: monitoring |
Configuration Details
| Field | Description | Example |
|---|---|---|
| Cluster | The name of the cluster where the probe will be applied. | my-cluster |
| Service Namespace | The namespace where the Black Box Exporter service is deployed. This is required for communication with the exporter. | monitoring |
| Service Name | The name of the Black Box Exporter service to be used for health checks | blackbox-exporter |
| Targets | A list of URLs or endpoints to monitor. These could be external URLs or internal service endpoints. | ["https://google.com (opens in a new tab)", "https://yourdomain/your-service"] |
| Interval | The frequency at which the probe will check the health of the target(s). This should be in a valid duration format (e.g., "30s" for 30 seconds). | 30s |
Finally click on Save button to save it.
Update Target Group
To update an existing Probe, click the Edit icon next to the probe you wish to modify, make the necessary changes, and then click the Save button to save it.
Remove Target Group
To delete an existing probe, click the Delete icon next to the probe you wish to remove, confirm the action, and then press the Delete button to finalize the deletion.