Alerts
The alerting feature within SkyU is designed to provide real-time notifications for a variety of system events, ensuring prompt awareness and enabling proactive management of your infrastructure and services. This helps teams stay informed about including critical issues, performance metrics, system health, and operational updates. Additionally, alerts are sent to the configured notification channels, ensuring that the right people are notified at the right time.
SkyU supports multiple alert sources to cover various monitoring needs: Prometheus, SkyU Alerts, and Third-party Alerts. Each source is tailored to different use cases, allowing you to customize the alerting flow according to your operational needs.
Sources of Alerts
Prometheus
Prometheus serves as one of the primary sources of alerts. (Prometheus Documentation (opens in a new tab)).
Setup: Installing and Configuring Prometheus with Alertmanager
To set up Prometheus and configure Alertmanager in your Kubernetes cluster, follow these steps:
Navigate to the Clusters Section:
Navigate to the Clusters section in the SkyU Console, located in the left-hand side menu.
Select the desired Cluster where you want to install Prometheus.
Install the kube-prometheus-stack Plugin:
Navigate to the Plugins section to view all available plugins. Click on the + Plugins button. Go to the All Plugins tab. Search for kube-prometheus-stack and click on Install.
Configure Alertmanager:
After installing the plugin, click on the plugin to enter the plugin details page.
Navigate to the Values tab, where the Helm release YAML file will load.
In the YAML, locate the alertmanager section, which contains the configuration for Alertmanager.
The receivers field should be updated as shown below. The necessary webhook URL can be obtained by navigating to Settings → Alerts in the SkyU Console. The required URLs for setting up the webhook integration will be listed there.
"receivers": [
    {
        "name": "webhook",
        "webhook_configs": [
            {
                "send_resolved": true,
                "url": "https://api.skyu.io/notifications-service/alerts/callback?..." // Get the URL from settings section
            }
        ]
    }
],
Other configurations can be adjusted according to specific requirements. For a detailed explanation of the configuration fields and options, refer to the official Prometheus Configuration (opens in a new tab).
SkyU Alerts
SkyU generates certain internal alerts, such as notifications for pipeline failures, cluster disconnections, and other system events. These alerts can be easily identified as they are tagged with the label system: skyu.
Third Party Alerts
SkyU also supports the integration of third-party alerts. This allows external services to send alerts to your SkyU environment for centralized monitoring. To configure third-party alerts, an email address is provided by SkyU.
Navigate to the Project and then Settings->Alerts section in the SkyU Console on the left-hand side menu.
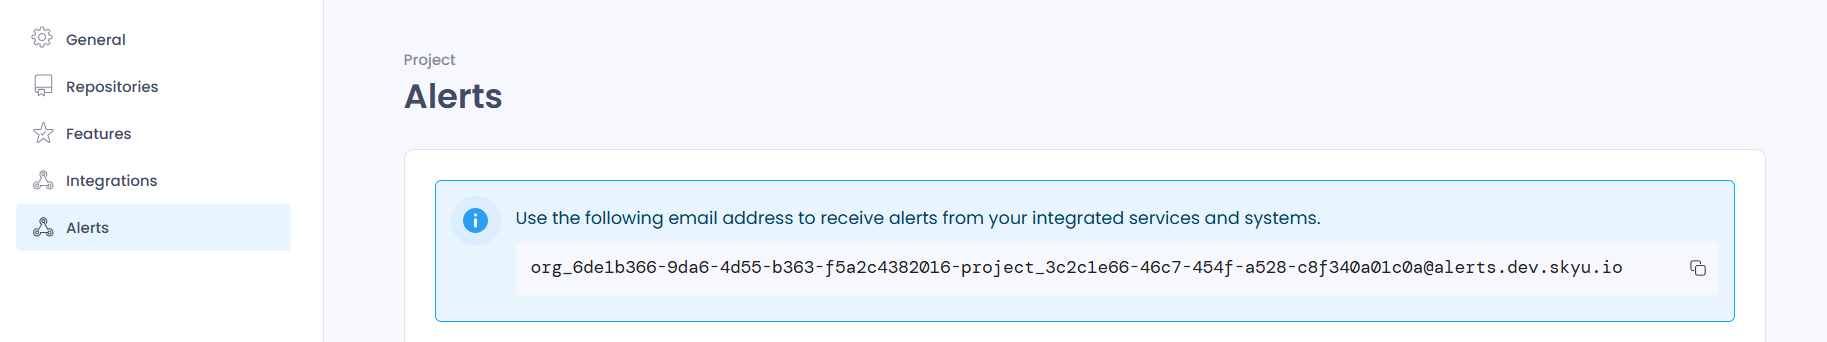
This email can then be configured within third-party services such as AWS, enabling them to forward their alert notifications directly to your SkyU environment. By doing so, SkyU will receive alerts from external sources, making it easier to track and respond to incidents.